Network Effects Total Guide
Network effects are one of the mysterious keywords in product development. I can see many articles about network effects, some of them are great, detailed, and for experts. But I can’t find an article that maps out each concept of the network effects and explains how they’re related. So, I determined to write this article so that we can come back anytime to remember details, relations, and concepts of the network effects.
Don’t just read this article or the attached product management articles. Instead, highlight where you resonate with and leave your thoughts and learnings with Glasp so that you can look back at them anytime and we all can get smarter at the same time ;)
If you're ready, let’s get to it.
Table of Contents
- What is Network Effects?
- Why Network Effect?
- Network Laws
- Property of Network
- Types of the Network Effects
- How to bootstrap the Network
- How to know it has Network Effects
- What you should keep in mind
- Confusing Concepts
What is Network Effects?
The network effect is “a phenomenon whereby a product or service gains additional value as more people use it.”
Michael Mauboussin’s (@mjmauboussin) description is “A network effect exists when the value of a good increases because the number of people using the good increases. All things being equal, it’s better to be connected to a bigger network than to a smaller one. Adding new customers typically makes the network more valuable for all participants because it increases the probability that everyone will find something that meets their needs. So getting big fast matters, not only because it creates more value, but also because it assures that competing networks never take hold.” This is explaining the network effects well. You can easily imagine that you want to join a network or place such as messaging app that has a larger number of your friends and family members because you’ll have more opportunities to message with them and it’s convenient.
There are many types of network effects. NFX breaks into 13 types of network effects in the order of strength;
- Physical (e.g. landline telephones)
- Protocol (e.g. Ethernet)
- Personal Utility (e.g. iMessage, WhatsApp)
- Personal (e.g. Facebook)
- Market Network (e.g. HoneyBook, AngelList)
- Marketplace (e.g. eBay, Craigslist)
- Platform (e.g. Windows, iOS, Android)
- Asymptotic Marketplace (e.g. Uber, Lyft)
- Data (e.g. Waze, Yelp!)
- Tech Performance (e.g. Bittorrent,Skype)
- Language (e.g. Google, Xerox)
- Belief (currencies, religions)
- Bandwagon (e.g. Slack, Apple)
• Two Powerful Mental Models: Network Effects and Critical Mass by Tren Griffin (@trengriffin)
Why Network Effect?
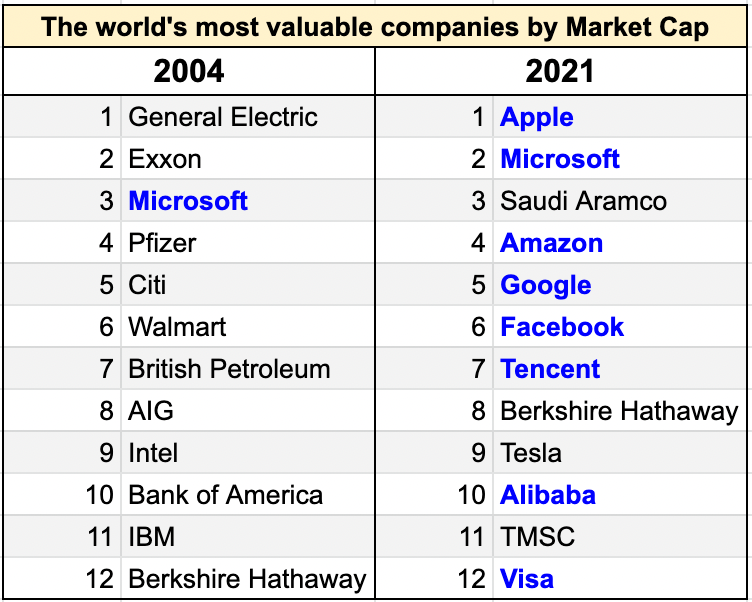
Network effects can explain 70% of all the tech companies’ value since 1994 and it is the best form of defensibility and value creation in the digital world (three others are brand, embedding, and scale). Today, factors that can create a moat against competitors including brand, supply-side economies of scale, intellectual property, and regulation are facing the thread, so the importance of the network effects is increasing.
Below are the top 12 valuable companies both in 2004 and 2021 and we can see that eight companies in 2021 have the network effects, whereas only one company in 2004.
The value getting from the network effect is increasing exponentially. The chart below is explaining how one user adds value to the network. In the chart, we can see that the value increases as the square of connections, whereas the cost increases linearly with connections.

*This chart is based on Metcalfe's law and it is said that the flaw underlying. Please take this as one of the explanation examples.
Network Laws
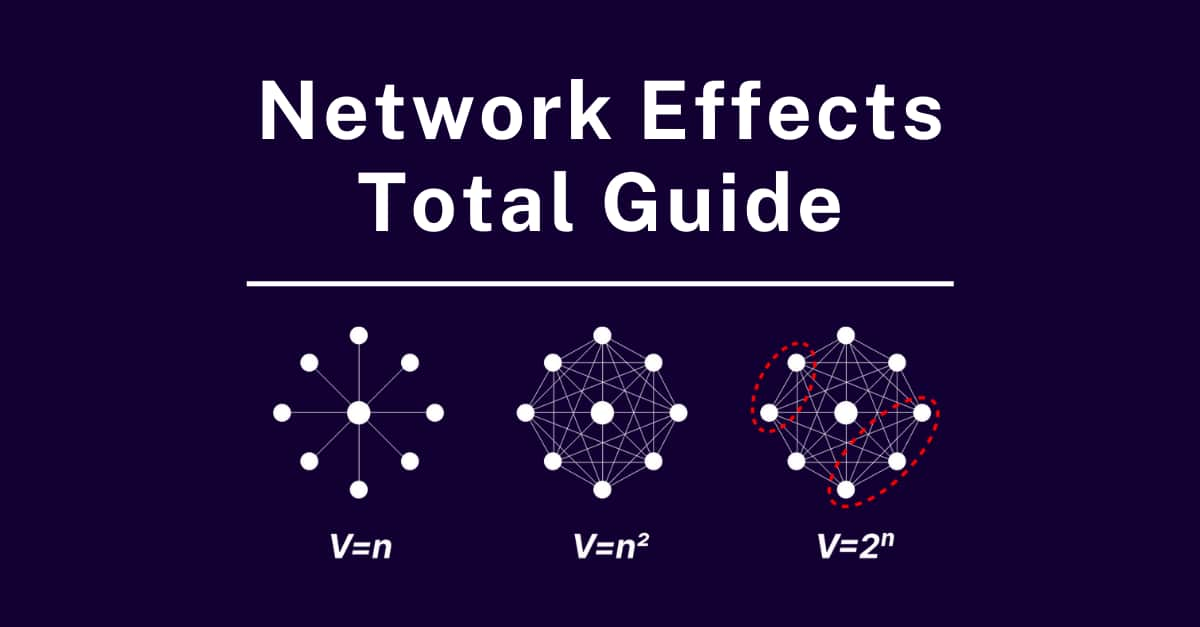
The most famous law explaining network effects is Metcalfe’s law, but there are some other laws about network effects.
Sarnoff’s Law
Sarnoff's Law is that the value of the network increases in direct proportion to the size of the network. The proportional to N, where N is the total number of users on the network. It accurately described broadcast networks with a few core nodes transmitting to a large number of peripheral nodes (a radio or television audience), however, Sarnoff's definition of network value turned out to be an underestimation for several sorts of networks.
Metcalfe's Law
Metcalfe's Law is one of the most famous laws in the network effects. The basic idea is that "the value of communications network grows in proportion to the square of the number of users on the network (N^2 where N is the total number of users on the network)."
Because the number of linkages between nodes on a network increases mathematically at a rate of N2, where N is the number of nodes, Metcalfe's Law appears to hold. Although it was initially coined to describe communication networks such as Ethernet, fax, and phone networks, it has now grown to include social networks and markets with the advent of the internet.
It is said that the fundamental flaw underlying Metcalfe's law because the power of network effects is not only influenced by the number of participants in a network, however, it assigns equal value to all connections or all groups. The affinity between participants is important, as is the value of commerce between them.
Reed's Law
Reed’s Law is in the group-forming networks, the value increases at a rate of 2^N, where N is the total number of nodes on the network.
Because the number of potential groups inside a network that "supports simple group communication" is significantly greater than 1, Reed proposed a formula of 2N instead of N2, because the total number of connections in the network (the network density) is not only a function of the total number of nodes (N2). In reality, it's a function of the total number of nodes plus the total number of potential sub-groupings or clusters, which increases considerably more quickly as the network grows.
Since most internet networks allow for cluster formation, they will almost certainly follow Reed's Law and expand in value at a significantly quicker pace than either Metcalfe's Law or Sarnoff's Law predicted.
Property of Network
Nodes and Links
Simply put, networks are made up of nodes and links.
Nodes are each individual participant of the network. It could be buyers, sellers, consumers, devices, and any individual user. Within the same network, various types of nodes might play quite diverse functions. It's worth noting that the value of the nodes is influenced by the strength and value of the nodes to which it's connected. A central node has a lot of linkages and is worth a lot more than a marginal node, which has fewer links and is worthless.
It's worth noting that the value of the nodes to which it's linked is influenced by the strength and value of the nodes to which it's connected. For example, marginal nodes having connections to a small number of powerful nodes have a higher value. are the links in a network between nodes or groups of nodes. There are differences in the strength, proximity, and activity of nodes, therefore not all relationships are created equal.
Links are the connections between nodes or groups of nodes in a network. Not all links between nodes are created equal. The directionality of links might vary. The strength of a link is determined by its endurance, closeness, and activity between two nodes.
Network Density

The ratio of connections to nodes determines the density of a network. The network will be denser if the ratio is larger.
In general, if the network has a higher density, then the network effects become more powerful. The interconnectivity of links reinforces and enhances the connections between other nodes.
Within a network, density is usually spread unevenly. Certain sections of a network might have significantly higher densities than others. So, you can look for a “white-hot center” of your network that is the densest and highest activity part and focus on creating a product and feature to make it happen. Because other nodes are attracted by the white-hot center’s activity and it will radiate outward from there much faster.
Directionality
The link between nodes can be either directed or undirected. The directionality determines depending on the nature of the connections between the nodes of a network. The directed connection means that one node points to the other in a unidirectional manner.
An example of a directed connection is Twitter. There are a lot of well-known people such as celebrities and politicians and they have huge followers, but it’s not usually affecting each other. The flow of information is one way, from the big central nodes to the small marginal nodes.
On the other hand, Facebook Messenger or WhatsApp, that the connections are necessarily reciprocal, is an example of an undirected connection. When you have a conversation with someone on the platform, the flow of information and interaction is bidirectional.
As you can see, which way, if any, the interaction between nodes in a network flows determines the direction of a link between nodes in a network. Money, information, communication, and anything else that may flow between nodes as they interact can all be part of that interaction.
One-to-One vs One-to-Many
Relationships between nodes in a network can be one-to-one, or they can be one-to-many. One-to-many connections are distinguished by the fact that they are directed linkages with a unidirectional interaction flow. In contrast, one-to-one connections are generally functionally reciprocal. As a result, they're undirected and interactive.
Clustering

If two clusters are connected by one link and no other links connecting two clusters, that connecting link is called a bridge. In a reality, nodes are rarely dispersed evenly. Nodes tend to cluster or form more tightly knit local groups than the network as a whole.
You can see clustering in personal utility networks such as Facebook Messenger. People form subgroups that are more active than the broader network.
The network whose clustering degree is high can have very powerful network effects because its value increases exponentially as a network grows.
Critical Mass

“The critical mass of a network refers to the point at which the value produced by the network exceeds the value of the product itself and of competing products.” The types of the network determine when it happens. Also, described as the number of members or network size required for the platform to self-grow — essentially, by having a value perception that rises faster than the network's expansion.
For instance, a telephone which is a physical direct network can gain critical mass in the early stage. Because if two people are using a telephone, then it has sufficient value that exceeds the inherent value of a single product on its own.
To fully benefit from the defensibility given by network effects, most businesses with network effects must eventually achieve critical mass. Before the network achieves critical mass, the product is extremely susceptible and may not be of any use to users. The issue with such products is frequently to create enough initial value to get early adopters to use the product even before the network effects benefit kicks in.
To learn how to reach the critical mass, go to a part “How to bootstrap the network” below.
Irregularity
Networks usually have irregularity. There are clusters, hot spots, and dead spots in a network. You can understand it easily by imagining a real-life example. Depending on the scale of a company (10 employees company vs. 1,000 employee company), location, or real-world relationship, the network is different.
Asymmetry
This term is mostly related to marketplaces and there are two types of asymmetry.
The first asymmetry is about the different levels of difficulty to acquire nodes on one side compared to another side(s).
The demand side of the marketplace — the buyers — might be difficult in some situations. In this situation, if you can attract customers who are eager to pay (buyers), providers (sellers) will usually turn up fast and with little effort. This is referred to as a "demand-side marketplace.”
In certain circumstances, the supply side is the more difficult aspect, and once the supply side is stable, demand-side customers are naturally drawn to the marketplace. This is referred to as a "supply-side marketplace." For example, the majority of Uber and Lyft's paid acquisition expenditure is spent on driver acquisition – the supply side. Similarly, OpenTable had to gradually acquire restaurants on the supply side, one by one, until it had built up enough supply to attract demand after seven years (people looking to make restaurant reservations).
Another asymmetry in marketplaces is about the asymmetry within a side or within a type of node. To put it another way, not all supply and demand are created equal. Typically, certain nodes will be more useful to add to your network than others, with some nodes being 1,000X more valuable than others.
• How to Kickstart and Scale a Marketplace Business – Phase 1: Crack the Chicken-and-Egg Problem 🐣 by Lenny Rachitsky(@lennysan)
Asymptotic Network Effects
The definition of the networks effects is “Network effects are mechanisms in a product and business where every new user makes the product/service/experience more valuable to every other user." However, network effects may begin to wane beyond a certain point in the network's development. After a certain scale, growth in an asymptotic network no longer helps the current users.
An example is Uber. Because Uber consumers don't gain much from an increase in the number of drivers after around a 4-minute wait period. As the demand side's rise in value approaches zero, the value of increasing supply "asymptotes.”
• The Intentional Network Effects of Uber by James Currier (@JamesCurrier)
• The Empty Promise of Data Moats by Martin Casado (@martin_casado) and Peter Lauten (@peter_lauten)
Same-Side Network Effects
Direct network effects that occur on the same side of a multi-sided network are known as same-side network effects (2-sided or N-sided network).
Uber has a negative same-side network effect because the more riders increase, the more time riders need to wait due to congestion or increase in price.
On the other hand, Windows have a positive same-side network effect. Because Windows users will gain benefit from the addition of additional Windows users due to file compatibility. Two Windows users may easily exchange files, and the number of individuals with whom you can share files rises as the number of people using the same platform grows.
Cross-Side Network Effects
Cross-side network effects, as opposed to indirect network effects, refer to the direct increase in value to users on one side of a network as a result of the addition of users on the other side in a network with more than one side.
For example, Uber has positive cross-side network effects because when each driver joins, riders will have more opportunities to ride a car faster and cheaper.
Indirect Network Effects
Indirect network effects arise when the value of a network rises as a result of one type of node directly benefiting another type of node while not directly benefiting other nodes of the same type. Same-side nodes benefit each other indirectly since they raise the motivation for complementing users on the opposite side of the network to use it, which benefits all nodes on the same side.

In a two-sided marketplace like eBay, for example, the addition of a new seller has no immediate advantage over other vendors. In reality, adding another eBay seller only adds to the competition for all other eBay vendors. However, because a larger inventory of items makes the marketplace as a whole more appealing to consumers, more vendors help other sellers indirectly as a result of the overall rise in prospective customers. With each new vendor, the value of the network grows indirectly.
Another notable example of indirect network effects at work is operating systems like Microsoft Windows. New Windows developers do not aid other developers in any way. However, as the library of Windows apps grows, so will the number of Windows users. Furthermore, growth in the number of Windows users is helpful to all developers since it expands the pool of prospective buyers for their software.
Negative Network Effects
In some situations, when the size of the network or the number of users increases, it leads to a decrease in the value of the network. There are two types of negative network effects. They are network congestion and network pollution.
Network congestion can be seen in traffic on road. In a rush hour, the more the number of cars increases, the more the network of the road is busy. Sometimes, you can see a similar situation in a telecommunication network, too.
Network pollution is observed on social media such as Twitter and Facebook. More content usually benefits users and increases the value of the network, but at the same time, there would be scams, fraud, and inappropriate content. You need to understand it, keep the positive network effects, and create a product feature to succeed.
Hidden Network Effects
In some companies, they have network effects, but they’re hiding in plain sight. Diamonds in the rough are companies with network effects that don't appear to be network effects. Because their networks are difficult to assess, they are frequently undervalued in the near term but disproportionately powerful in the long term.
Network effects that don't appear to be network effects might provide distinct benefits that can help a firm achieve long-term success. While it has distinct advantages, they also present unique hurdles for entrepreneurs to overcome.

Slow network
Slow networks are the network that relatively takes time to show the value of the network since it’s started.
Long product consumption loops and/or infrequent cadences are common in sluggish networks, slowing down network effects. Slow networks, in contrast to rapid networks, are sometimes undervalued since the benefits aren't immediately apparent. Even if the firm is developing swiftly, it might take years for a sluggish network's network effects to show.
For example, the network effects in Lambda School are simple to comprehend in principle. They should be able to (1) locate more businesses that want to recruit Lambda grads as they acquire more (and better) students, and (2) establish a deeper network of Lambda alumni for recent grads to lean on, learn from, and be hired by as they get more (and better) students. But it takes years before the true value of their network begins to reveal itself.
Unfinished networks
An unfinished network is temporarily incomplete in some way due to a product feature or strategic decision. However, once the network is complete, the network effects are immediately apparent.
OpenTable was a successful example of an unfinished network a few years ago. In its early days, OpenTable appeared to be more of a software as a service (SaaS) company than a network effects company. Restaurants paid $200 a month to OpenTable to allow them to take reservations online, and the OpenTable widget was embedded on their website.
As OpenTable grew in popularity, it saw the potential to become the most convenient way for diners to find new restaurants. They were able to invest in their consumer-facing goods, such as their website and applications that assist users to locate restaurants, after they had enough eateries, and so completed the network. More diners = more restaurants = more network effects.
Throttled network
A throttled network is one in which the size or participation of the network is materially limited by a product feature or strategic decision, disguising the strength of network effects.
Facebook was, in some respects, a throttled network in its early days. To participate, users had to have a Harvard email address. This was gradually expanded to others with.edu email addresses, and then to the whole public. This is how a throttled network is defined. While Facebook didn't limit user involvement on the site, which made network effects more visible, it did limit the network's breadth on purpose.
Latent networks (aka “Come for the network, stay for the tool” networks)
There are also plenty of companies that start with the tool or product and then work their way up to the network. The classic examples of a "come for the tool, stay for the network" company are Delicious (with bookmarks) and Instagram (with filters). However, some businesses begin by establishing a network before developing a product or technology.
The idea is to start by developing a community that functions as a network, with individuals connecting, participating, and providing value to one another. A product is eventually launched that catalyzes or amplifies the network's engagement. Because there isn't anything assessing or monetizing the network before the product comes, it might be impossible to discern the network's strength and potential before the product arrives.
These latent networks are the most difficult to forecast and implement of all the "hidden network effects." These communities are frequently an audience rather than a latent network, implying that consumers value the center node rather than the network. When the tool or product is only an audience, it scales more like a linear business (e.g., a DTC product) than a network. It's tough to tell a network without products from an audience. Many a celebrity entrepreneur has mistakenly felt they had built a network of people who wanted to interact with one another, only to discover that what they really had was an audience hungry for a piece of their famous idols.
• Hidden Networks: Network Effects That Don’t Look Like Network Effects by D'Arcy Coolican (@DCoolican)
Types of the Network Effects
Direct
Increased utilization of a product results in a direct rise in the value of that product to its consumers, which is the strongest and simplest network effect.
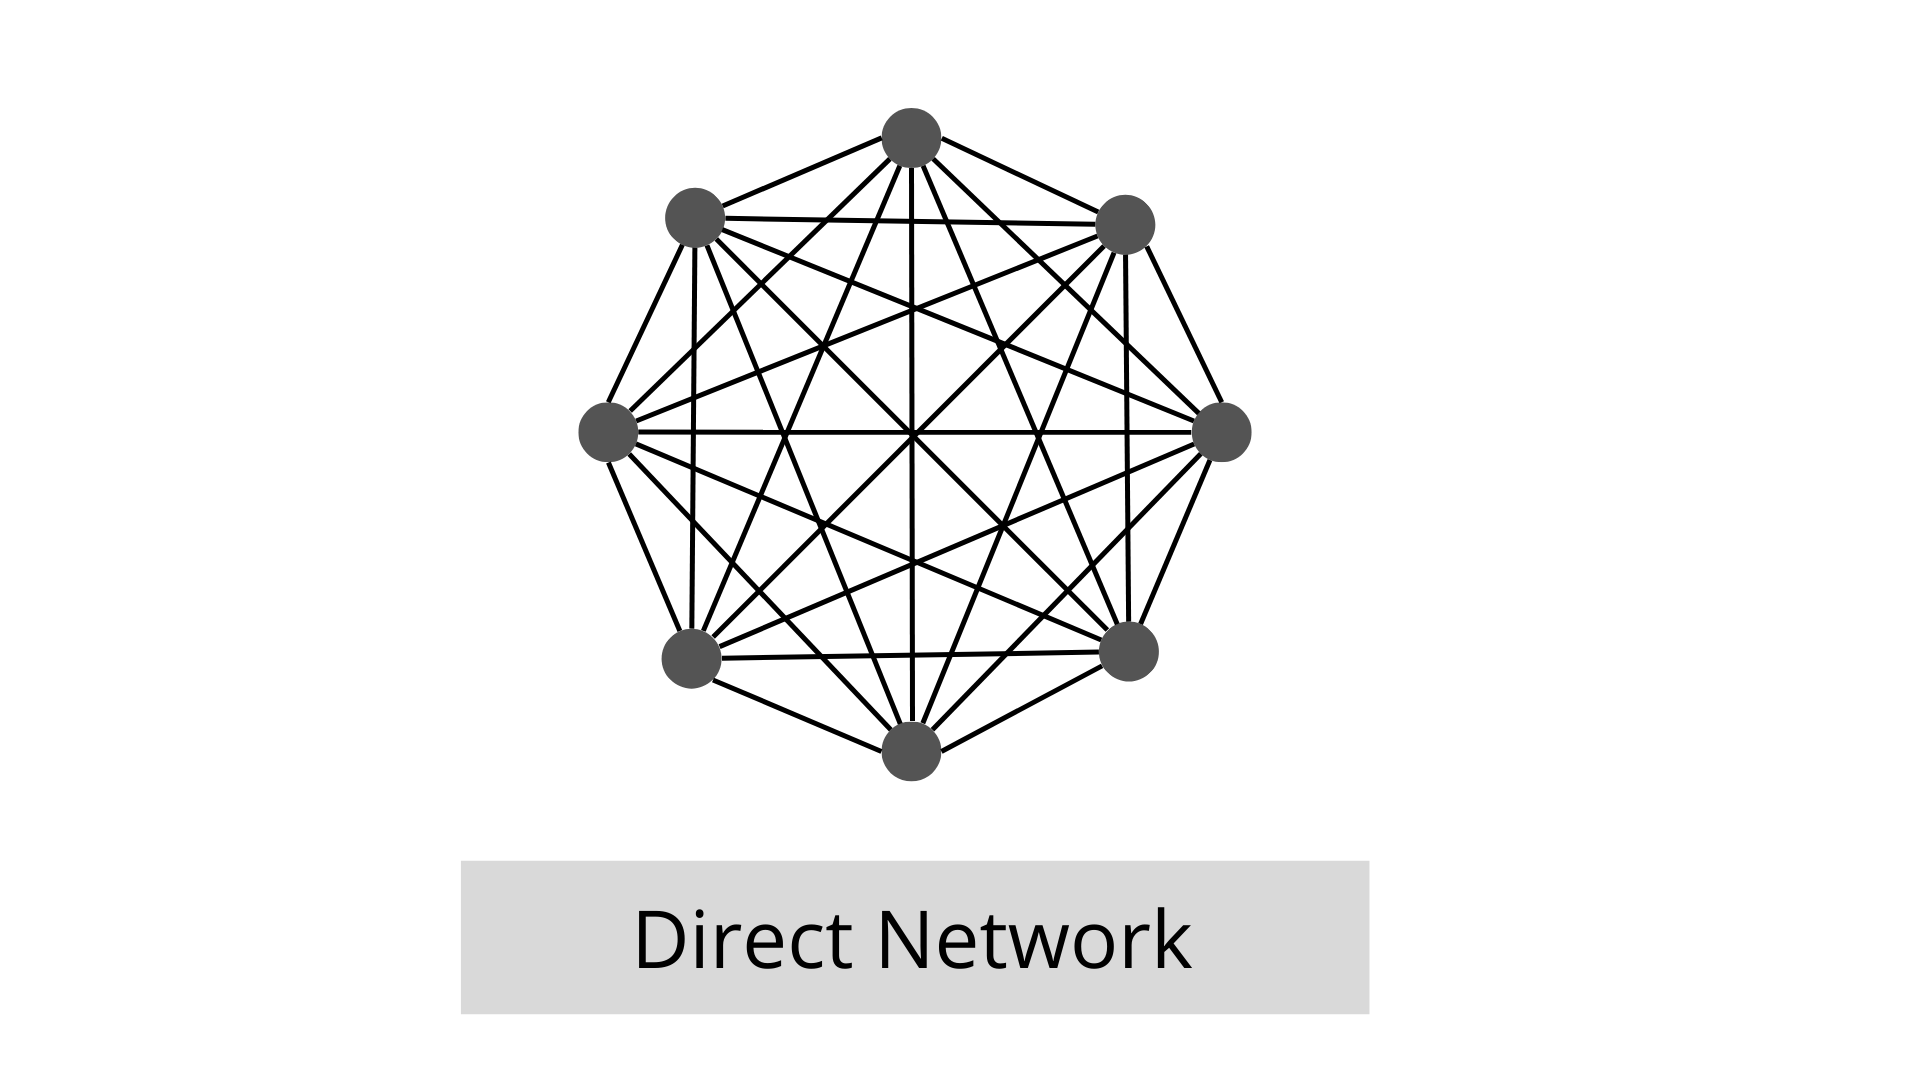
As seen in the diagram above, each node in a digital network is connected to every other node. Every new node that enters a direct network adds a new link for all existing nodes, hence the number of new connections (network density) grows as the number of nodes grows squarely (N2). Each extra node adds to the network value at a geometric pace since the value of a network is proportionate to its density.
Direct network effects have five different types.
Physical
Direct network effects related to physical nodes (such as telephones or cable boxes) and physical links are known as physical direct network effects (e.g. wires in the ground). This is the most defensible network effect type since it has both a direct network effect and the ability to add extra defensibilities, such as scale effects and embedding. Competing against a corporation with Physical Network Effects necessitates a significant upfront capital investment as well as physical constraints.
Businesses having physical direct network impacts include roads, railroads, energy, sewage, natural gas, cable, and broadband internet. In reality, the majority of Physical Networks are utilities: winner-take-all marketplaces that monopolize and are eventually nationalized.
The fact that so many of them provide poor or inadequate services while yet leading the market is the strongest proof for their strong defensibility.
Protocol
When a communication or computational standard is declared, all nodes and node creators are able to connect to the network using that protocol. Protocol networks, like Bitcoin and Ethereum, are relatively new. A single corporation, a collection of companies, or a panel can be the protocol setter.
An example of a Protocol Network Effect is Ethernet. Robert Metcalfe convinced DEC, Intel, and Xerox to adopt Ethernet as a standard protocol for local computer networks, with a standard speed of 10 megabits per second, 48-bit addresses, and a global 16-bit Ethertype-type field, when he created 3Com. There were competing proprietary protocols, but as Ethernet gained traction and market share, Ethernet-compatible products inundated the market. Regardless of their relative performance, this enhanced the value of Ethernet at a compounding rate and diminished the value of rivals. Ethernet connections quickly become common on all current computers.
Marketing, social engineering, and market niche selection are frequently more important than technology in the success of such an adoption approach. That's why VHS triumphed over Betamax, even though Betamax was undoubtedly a superior format.
Personal utility
Personal Utility Networks are distinguished by two characteristics. The first is that users' personal identities are linked to the network in question, with usernames commonly attached to real names, as is the case with Facebook Messenger. The second reason is that they are required in users' personal or professional lives on a daily basis.
People utilize Personal Utility Networks to connect and interact with their networks. So, opting out would become a big obstacle in everyday life and might have a considerable negative impact on people's vital personal and professional connections.
Personal
When a person's identity or reputation is linked to a product, personal network effects come into play. People on Personal Networks are frequently persuaded to join by people they know in real life. If everyone you know in real life is using the same product to save their identity and reputation, there's a lot of value (for you) in joining the network.
Personal Networks incorporate personal identification and reputation, and they connect each user's persona to the personas of other users. Each extra node represents a new potential audience member as well as a new content provider for the rest of the network.
In two aspects, Personal Networks vary from Personal Utility Networks. Personal Utility Networks are commonly utilized for tasks that must be completed. The user will find a significant amount of practical value. Second, rather than being used for public communication, Personal Utility Networks are primarily used for private communication. Personal networks aren't as important as they once were. You can quit using them and your life will not change much. When you're not looking for work, social media sites like Facebook, Twitter, and Linkedin aren't normally necessary.
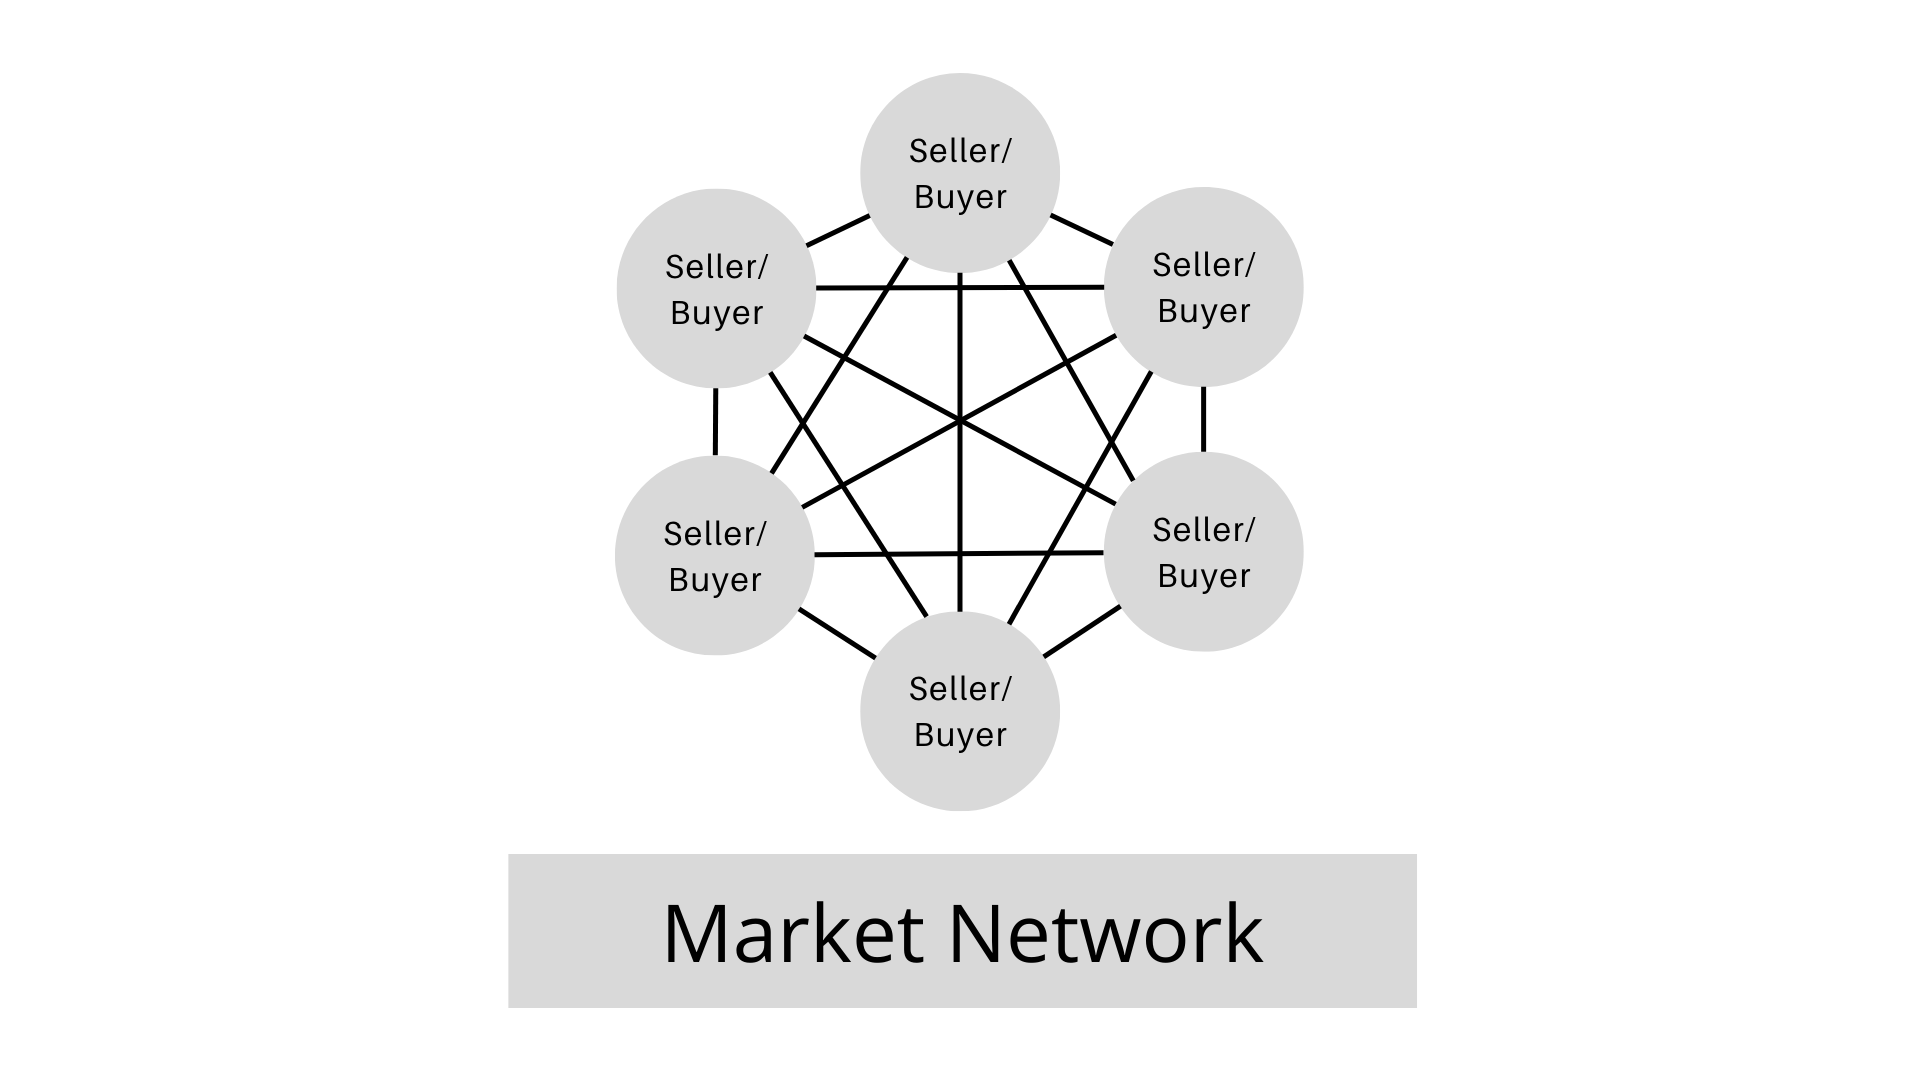
Market Network
A Market Network combines the identification and communication features of a Personal Network with the transactional emphasis and purpose associated with a marketplace. Market Networks typically begin by improving an existing offline network of experts. Because the link between nodes is direct, we consider Market Networks to be a type of direct network effect.
2-Sided Network Effects
In academic literature, the second large type of network effect, 2-sided network effects, is referred to as "indirect network effects." However, because 2-sided networks can have both direct and indirect network effects, this is misleading. The fundamental distinguishing feature of a 2-sided network is the existence of two distinct user classes: supply-side and demand-side users. They all come to the network for different reasons, but they all add value to the other side.
So far, they identified three types of 2-sided network effects.
Marketplace
Buyers and sellers are the two sides of a marketplace. Two-Sided successful marketplaces such as Craigslist are notoriously difficult to disrupt. To separate them, you must provide a better value proposition for both parties at the same time, or no one will move. Customers come to buy from merchants, and vendors come to buy from customers. One will not be able to leave without the other.
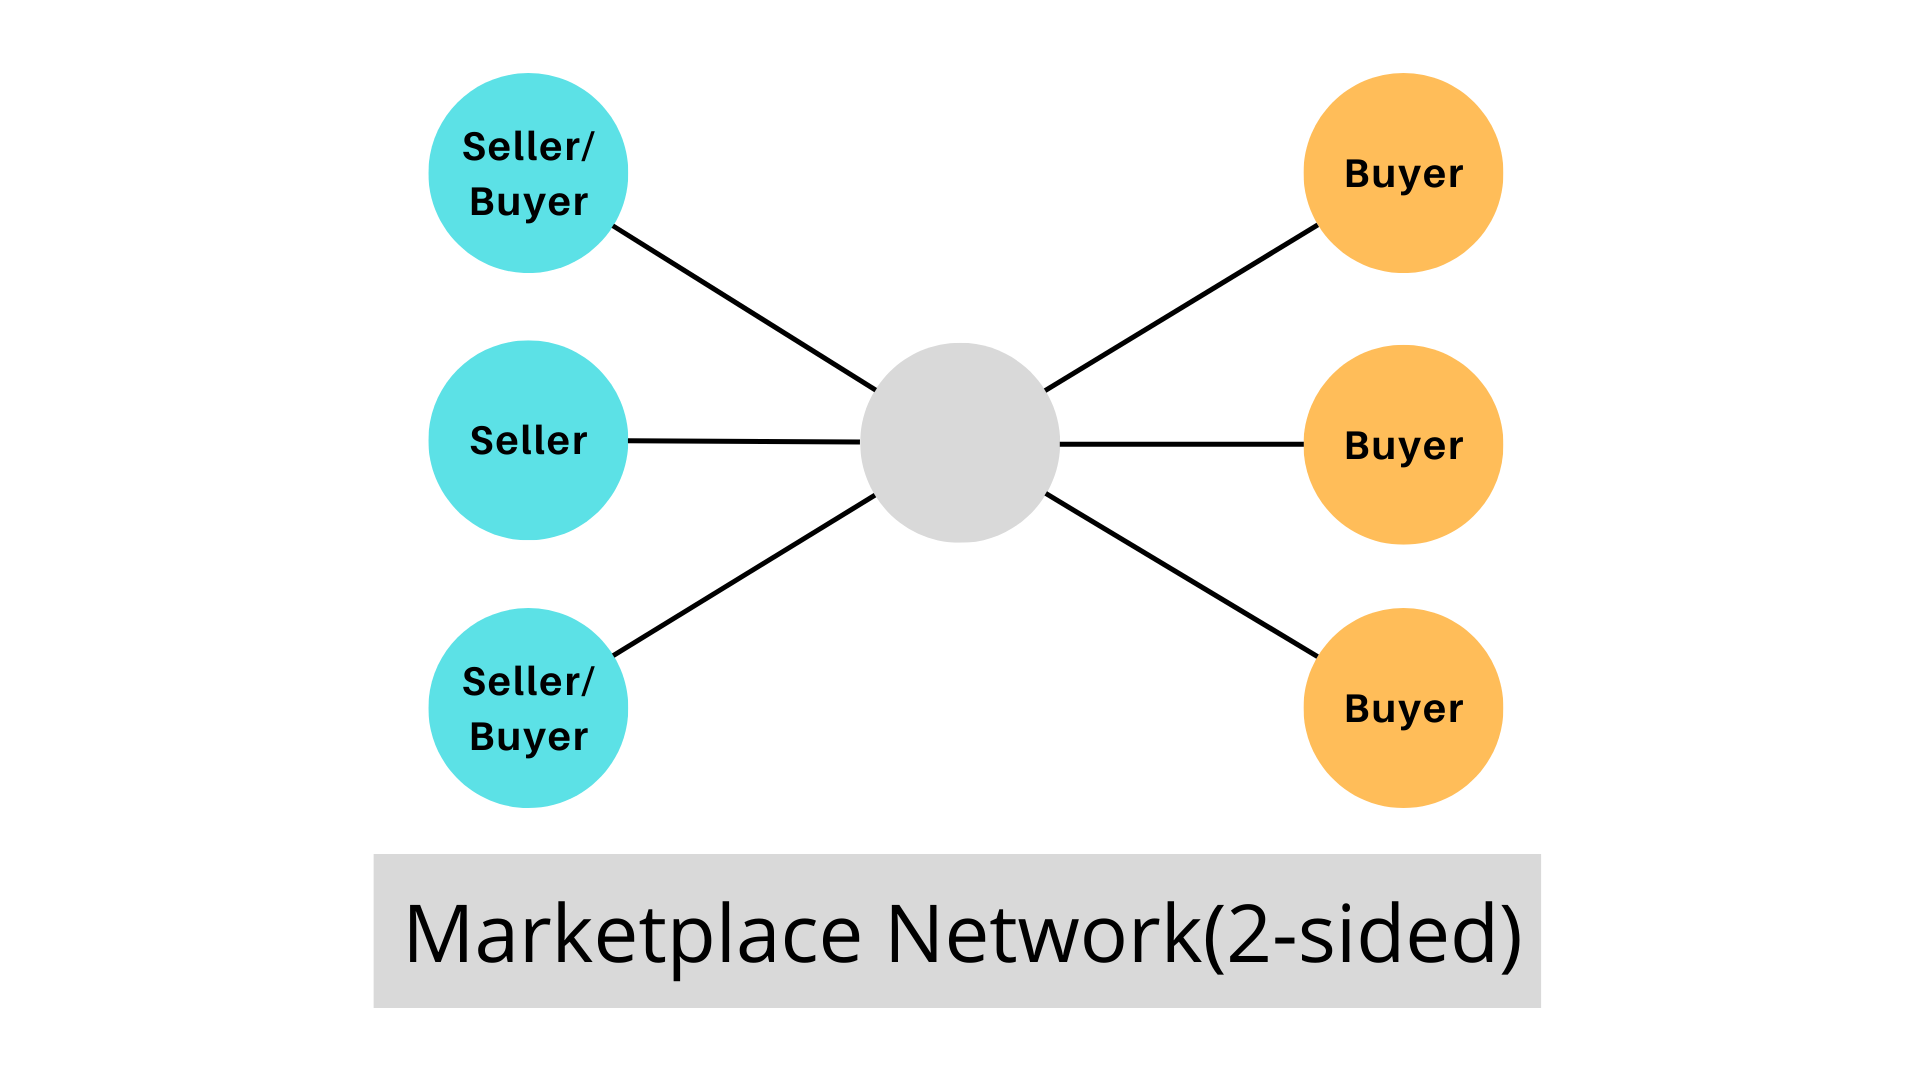
The network, not the app or website itself, provides the majority of the value in a 2-Sided Marketplace, which is why marketplaces like eBay and Craigslist can afford to appear virtually the same for more than a decade.
The occurrence of "multi-tenanting" exposes one significant flaw in marketplace defensibility. People can sell their items on both eBay and Etsy simultaneously. Landlords may advertise their apartments on Craigslist and Trulia, and tenants can search for available apartments on both sites.
The marketplace's purpose is to build the product/service to add so much value or "lock-in," particularly on the supply side, that members aren't enticed to multi-tenant.
Platform
2-sided platforms have supply-side nodes (developers) and demand-side nodes (users), who exchange value through the platform's middleman (central node). The platform itself is beneficial to both parties.
2-Sided Platform network effects are similar to 2-Sided Marketplace network effects in that they contain two opposing sides with opposing goals that benefit one other direction. The supply side, on the other hand, creates products that are exclusively available on the platform. The supplier side will have to put in some effort to integrate with the platform. Supplier-created and sold products are a function of the platform, not apart from it.
Another difference platforms have from marketplace network effects is that, compared to online marketplaces, the features and benefits of the platform itself can play a greater role in the utility of a platform relative to the network. Platforms have a vulnerability in that, like marketplaces, both sides of platforms might be multi-tenant.
Asymptotic Marketplace
The asymptotic marketplace is its network effects may begin to wane beyond a certain point in the network's development. After a certain scale, growth in an asymptotic network no longer helps the current users.
Let’s look into the value getting from the network effect. And the graph below shows the value curve of different types of marketplace.
The red one is an asymptotic marketplace. In the beginning, the increase in the number of nodes increases the value immediately, but at a certain point, the nodes cannot get more value beyond a certain degree.
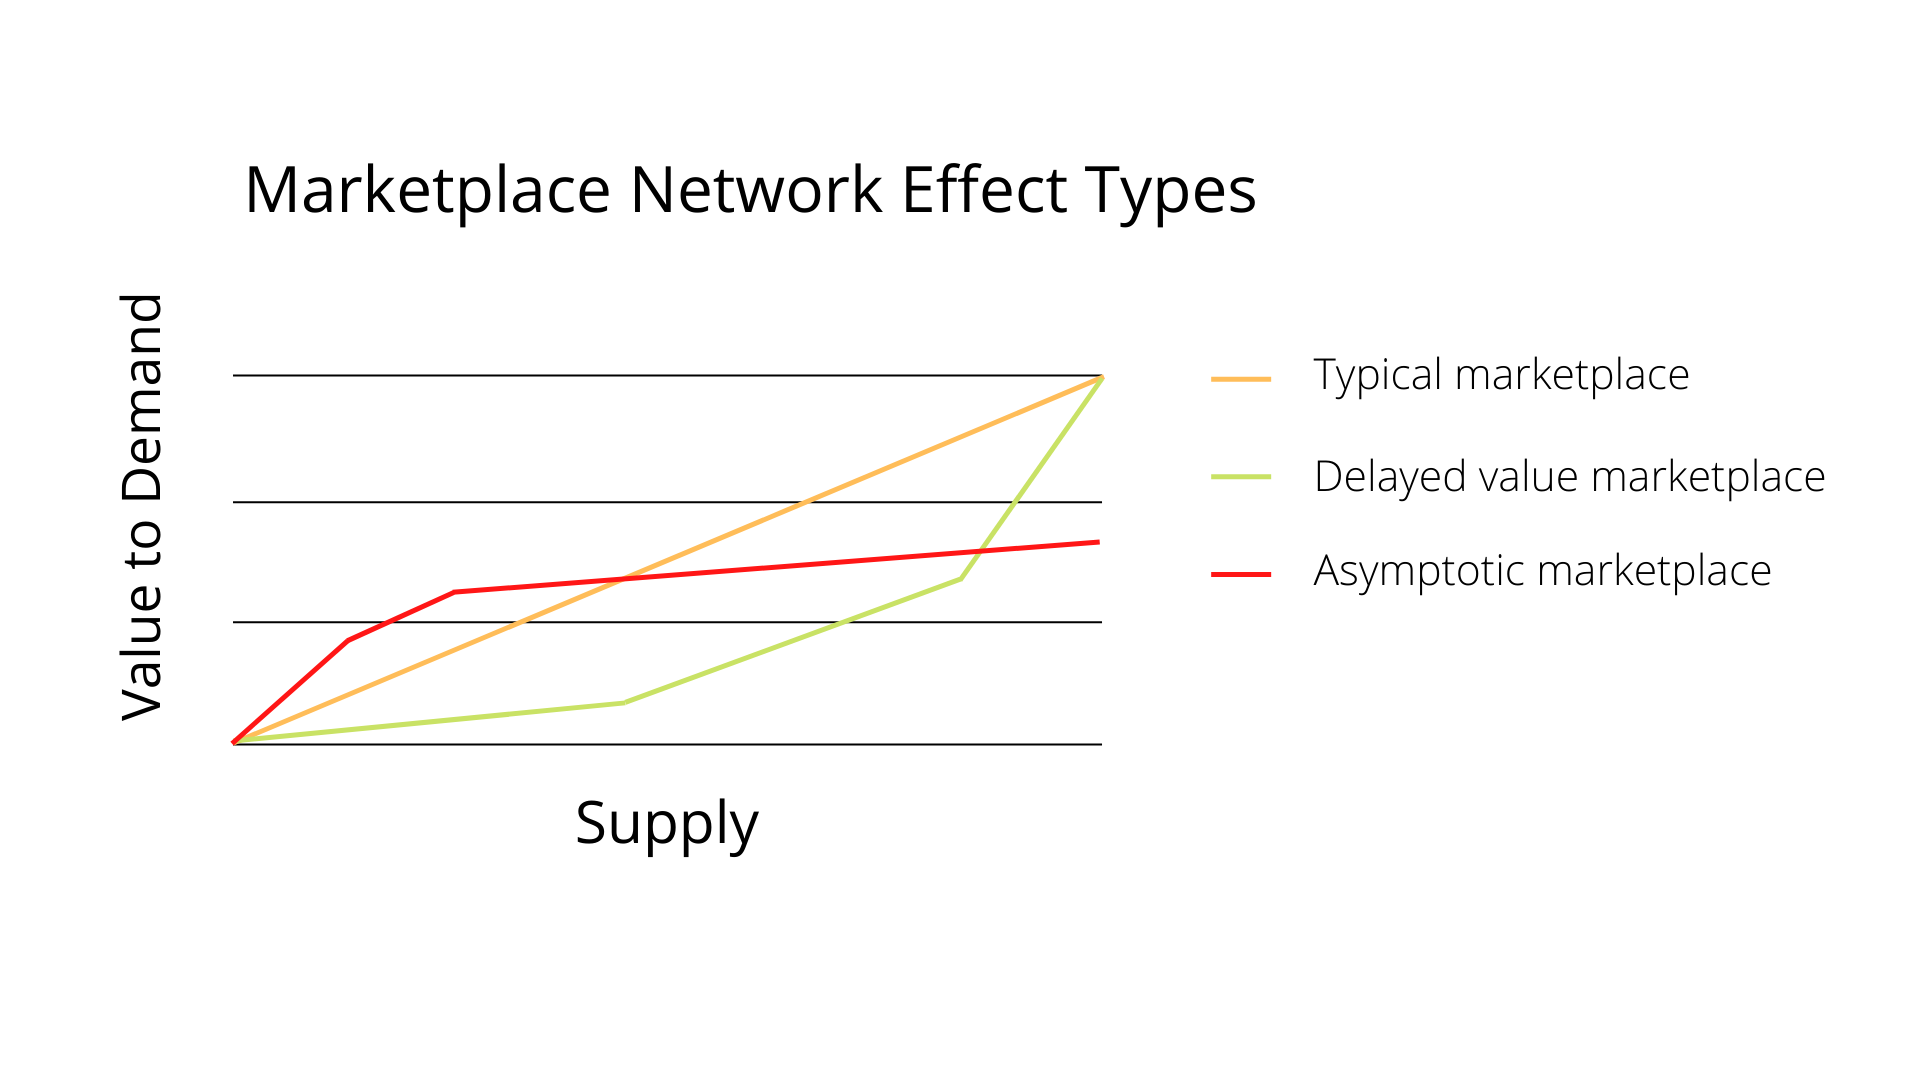
An example is Uber. Because Uber consumers don't gain much from an increase in the number of drivers after around a 4-minute wait period. As the demand side's rise in value approaches zero, the value of increasing supply "asymptotes.”
Asymptotic Marketplaces are more susceptible to competition than other types of markets. Multi-tenanting can make Asymptotic Marketplaces even more vulnerable. Many individuals use both Lyft and Uber to get around, depending on which one offers the best prices and the shortest wait times at the time.
Data
A Data Network Effect occurs when the value of a product rises as more data is collected, and as more data is collected, the product's value rises.
Each node in a data network feeds important data to the central database. As the value of the aggregated data grows, so does the value of the data for each user.
There is no network effect; there is only a scale impact if a product has no relationship between more usage and more meaningful data production.
Waze is an excellent example of a service with a significant Data Network Effect. Not only does almost everyone who uses Waze contribute useful data, but because the data is used in real-time, the dataset must be updated regularly. As a result, the wider the network, the more accurate the data for any individual road will be at any given time. Waze has a lower asymptotic data network effect than virtually any other service we can think of since more data produces value almost indefinitely.
Tech Performance
Tech Performance Network Effects occur when a product's technical performance improves directly as the number of users increases. The more devices or users on a network with Tech Performance Network Effects, the better the underlying technology operates. As a result, the product/service becomes faster, less expensive, or easier to use.
The Tech Performance Network is different from a technological advantage. Technological advantages don’t have long-term defensibility because competitors can catch up.
”Social” Network Effects
Social network effects are describing the psychology and the interactions between people. Among people, there is an unseeable network that connects us. And our physical body is a node and our body language and words are the links.
The more people use it, the more you can create a valuable product for them by giving a reason to use it, by reinforcing their choice to continue using your product.
Social network effects are the hardest to build and keep for the defensibility, however, if you can build it, it’s a big advantage for your product.
Language
Language is a protocol for the human networks to interface with each other. Throughout history, language has displayed a “winner-take-most” tendency. Jargon becomes increasingly valuable to all users as it is embraced by a larger number of people.
If you are a startup founder, you can leverage language network effects in two ways.
The first way is to create a business category and become the one known as #1 in the category. It gives a solid network effect. Let’s take an example. Bitcoin is known as the #1 in the crypto and benefited the most. There are a bunch of cryptocurrencies, bitcoin accounts for nearly 40% of all the market capitalization.
The second way is to name a company or product. When people listen to “grab an uber”, it means that you take a private taxi and go to the destination. “Googling” is another great example.
Belief
You can find belief network effects in gold, Bitcoin, and religion. When people believe in something, others are more inclined to believe in it as well. As a result, there are significant social ramifications for not believing what your friends believe, and possibly even greater ramifications for quitting to believe what they believe.
The thing is the more people believe in belief, the more belief becomes valuable for believers.
Bandwagon
Bandwagoning occurs when people feel compelled to join a network because they don't want to be left out.
For example, in 1998, when people started using Google, there was a general feeling that cool people were using Google. People who didn’t use Google have left out the community.
Apple is also a great example of bandwagon network effects. Every year, they manufacture buzz and FOMO for their new product demo and launch with their sophisticated performance.
Contents Network Effects
Content network effects are created by content platforms hosting videos, blogs, and other content. This allows businesses to swiftly get to the point where they're offering greater value to new users, as opposed to the connection model, which relies on existing users in a social circle.
Created content on content platforms is the origin of competition. Videos on YouTube snaps on Instagram, and Pinboard on Pinterest are the primary source of value for users.
Content network effects are said that one of the solutions for the chicken-egg problem. Products such as Facebook and Twitter were focusing on connecting people in the network in the beginning. However, Behance and Pinterest are letting users create content, then later users enjoyed generated content, and that made users keep using the product.
• The Power of Network Effects: Why they make such Valuable Companies, and how to Harness them by Eric Jorgenson (@EricJorgenson)
How to bootstrap the Network
There are mainly two ways to bootstrap the network which is to solve a chicken-egg problem.
The first solution is to create a single-mode utility tool and build a network later, as know as “Come for the tool, stay for the network”.
The basic idea is to initially attract users with a single-player tool and then, get them to take part in a network. The tool helps reach the critical mass.
A great example is Instagram. They started an app to provide innovative photo filters. There was a similar app called Hipstamatic and it has a filter, but it’s not free. Instagram made it users easy to share photos on their networks such as Facebook and Twitter. However, Instagram built its network and allowed users to share snaps on it, which made Instagram a giant network over time.
Traditionally, social networks were trying to connect people in the network from the beginning. You would know as a magic number such as make 7 friends in 10 days for Facebook, follow 30 people for Twitter. However, recent apps let users create content first, and then it will have a content network effect when it has much content. Therefore, content platform companies provide great utility tools to create and publish content. Some examples are Behance and Pinterest.
The second solution is to use token incentives. Thanks to the development of Web3, we are now able to issue tokens with financial incentives. Its basic idea is “Early on during the bootstrapping phase when network effects haven’t kicked in, provide users with financial utility via token rewards to make up for the lack of native utility.” Web3 model is fairer than the centralized Web2 model because the people who helped build a community can own a piece of it.

• The Web3 Playbook: Using Token Incentives to Bootstrap New Networks by Chris Dixon (@cdixon)
How to know it has Network Effects
Depending on your type of product, there are a bunch of metrics that you can verify it has network effects or not. Overall, there are five types of metrics.
The first group of metrics is related to an acquisition.
1. Organic vs. paid users: What percentage of your new users are organic?
If your product has network effects, the portion of organic users relative to paid users is going to increase over time. Because a grown network has a value that attracts people to join, so more users should want to join on their own.
2. Sources of traffic: As the network grows, how much traffic/transactions on the network are generated internally, arising from the network itself vs. from external sources?
You can measure traffic sources by separating - how much traffic or transactions on the network is direct vs. arising from external sources. If you find that more traffic coming directly, it means users are finding the network more valuable as it grows.
For example, as Medium grows, more people find content on Medium, not through external links. This is a typical example of “Come for the tool, stay for the network”.
3. Time series of paid CAC: How much do you need to spend to acquire supply?
While the paid CAC (client acquisition cost) in a business should decrease over time as the network effects "flywheel" accelerates. However, this is theoretical, and in practice, it is affected by a variety of factors.
The second group of metrics is related to competitors.
4. Prevalence of multi-tenanting: How many of your users also use other similar services? How many users are active on similar services?
We should understand that if your users are using similar services, including related services even though the functionality may not be the same. Once you know that your users are also using competitors’ services, you can shore up your product to prevent your users from going somewhere else.
5. Switching or multi-homing costs: How easy is it for users to join a new (and even a non-existent) network? How much value can users get as a new user from joining a different network?
It’s important to understand how easy it is for users of one network to signup and complete the onboarding process for a competitor’s network. If the competitor’s product is frictionless and new users can gain value in the beginning (cold start), it promotes users getting to multi-tenanting and switching over.
The third type of metric is related to engagement.
6. User retention cohorts: Is your user retention improving for newer cohorts?
Users who sign up later can get more value than the value that users who signed up in the past because network effects are to increase a value as the number of users increases. Therefore, if your product has network effects, the retention rate is improving for newer cohorts.
7. Core action retention cohorts: Is retention, as defined by users taking a core action for the product, improving for newer cohorts?
The core action is the action corresponding to deriver value from your product, so as the network density and effects grow, you should expect to see improving retention based on this core action.
8. Dollar retention & paid user retention cohorts: Are newer cohorts retaining better on a dollar basis, for every given time period, than older cohorts?
If you’re building subscription and paid products, you need to pay attention to dollar retention and paid user retention. In terms of cohort revenue, the newer cohort should have higher retention because paying for a product indicates the degree of value of the product.
9. Retention by location/geography: Are participants in the oldest markets — for businesses with local network effects — better retained, than those in newer markets?
The oldest or most established markets tend to have a higher retention rate than newer markets. Because for local network effects product, the network effects exist per market, and it’s not transferrable to a new market. Therefore, older markets where geography matured and built network density should have better retention.
10. Power user curves (aka L7 & L30 charts): Are users shifting to the right side of the power user curve? In other words, are they becoming more engaged over time?
Power-user curves (also known as L30 charts for 30 days of use or L7 charts for 7 days of use) are histograms of user engagement that illustrate the total number of days users were active in performing a specific action during a specific timeframe. Seeing how often customers execute a given action on a cohort basis allows you to understand if a product is gaining utility with more users when studying network effect enterprises. If a product is more valuable with more users, a growing percentage of users should transition to higher-frequency engagement buckets, or a more right-leaning power user curve, over time.
The fourth type of metric is related to the marketplace.
11. Match rate (aka utilization rate, success rate, etc.): How successfully can the two sides of the marketplace find each other?
People come to the market for demand or supply. Then, the market should match these two types of people. The match rate shows how much people can meet their expectations, such as buyers can find sellers, etc.
The operator of the marketplace should find the reason why the matches don’t happen and do increase the match rate through updating incentives, improving product design, and other mechanisms.
12. Market depth: Is there enough supply and does it fit users’ needs?
The term "offer depth" or "market depth" comes from the financial markets, and it refers to a market's ability to withstand relatively big orders without price fluctuations. The depth of the market is determined by the number of buy and sell orders placed at each price.
The market depth affects user experience and determines whether users will be able to find a match. The more market depth, the more opportunity for users to find a needed service or good, however, too much supply causes challenges in discovery, which resulted in a negative network effect, so the marketplace should reduce the search cost.
13. Time to find a match (or inventory turnover, or days to turn): How long does it take for supply and demand to match?
The shorter time to match, the more opportunity for both sellers and buyers. And it increases the value of the marketplace.
For example, you can see how long it takes for an employee to find a candidate in the job marketplace or for sellers to sell a good on OfferUp.
14. Concentration or fragmentation of supply and demand: How concentrated is the marketplace on the supply and demand sides?Marketplaces with higher fragmentation on both the supply and demand sides are more valuable and defendable. This means that no single member on the demand or supply sides accounts for a disproportionately large share of transactions, making the business more sustainable and diverse. If demand or supply on a marketplace is too concentrated, a significant buyer or seller may be able to take a large percentage of transactions with them if they decide to quit.
The last group of metrics relates to economics.
15. Pricing power: How much are you able to charge for your product? What would your customers be willing to pay to stay on the network?Participants are willing to pay for access to the network if they gain more value from the network. The payment type could be subscriptions, listing fees, or other types of monetization.
16. Unit economics: How is the business doing, basically?
Improved network effects are frequently reflected in better unit economics over time. This is due to a decrease in the number of incentives that businesses must provide to various segments of the market, a lower share of paying users, and an overall increase in pricing power.
• 16 Ways to Measure Network Effects by Li Jin (@ljin18) and D'Arcy Coolican (@DCoolican)
What you should keep in mind
Even if your product has network effects, there are a bunch of things you should keep in mind and address to keep the defensibility.
Multi-tenant
Multi-tenant is to use multiple platforms or services which is similar to yours at the same time. It happens when the switching cost to join competitive networks is low or zero.
Example of multi-tenant is Uber and Lyft. Riders can have both Uber and Lyft at the same time, compare the price and time, and determine which one to use.
It also happens on social media such as Instagram, TikTok, and Snapchat. Users post the same content on all platforms.
Multi-tenanting can reduce a network's defensibility and attenuate network effects, but only to a certain extent. The larger network will win out in the end because it will have a greater profile for possible new customers and will be more likely to keep existing customers, even if those consumers are multi-tenant on occasion.
Disintermediation

Disintermediation happens when users initially start transacting on the marketplace or market network and take future transactions off the product and transact directly. It’s often seen in marketplace or market networks, and it is a significant vulnerability because, for most transactional networks, retention is important and a source of monetization.
Switching Costs
“Switching costs are the costs that a consumer incurs as a result of changing brands, suppliers, or products. Although most prevalent switching costs are monetary in nature, there are also psychological, effort-based, and time-based switching costs.”
If the switching cost is high, customers tend to lock in because the customer has an incentive to stick with the same service or platform throughout their life cycle.
Retention
Retention is how frequently your users return to your product to use it. For the product team, retention is the most important metric you should track. Because if you have high retention, then it’ll be easy to find some type of network effects and it means that your user finds value in your product or service.
Weak network effects result from networks with ineffective retention, and weak network effects lead to low retention. Remember that network effects are caused by total utilization, not by the network's size. That's why expanding a network's size isn't enough; increasing usage is equally critical.
Real Identity vs Pseudonymity vs Anonymity
Usually, networks with profiles tied to a real identity are more effective at creating network effects than networks with pseudonymous profiles and anonymous profiles.
Successful social networks such as Facebook and Linkedin are the ones requiring a real identity profile at scale. Real identity is also important for the marketplace and platform to network effects businesses where reputation and trust accelerate the transaction.
Using actual names boosts user engagement, which leads to increased network size, density, and activity – all of which contribute to a greater network effect in your organization. The network effects are more powerful the more engaged and committed the nodes in the network are.
Twitter, Reddit, and Snapchat all feature usernames that aren't the same as people's real names, yet they're nonetheless used. This is because, unlike the dead anonymous/pseudonymous networks outlined before, their user identities are permanent over time and somewhat related to real-world identities.
The Evaporative Cooling Effect
The Evaporative Cooling Effect highlights the phenomena in which high-value members leave a community because they can't get anything out of it, lowering the community's quality.
New people joining the community later tend to be people whose quality is less than the average, therefore, as the community grows, the quality of community decreases as well.
To address it and minimize the influence of the evaporative cooling effect, there are some suggestions for you.
The first one is to have a social gate. Some forms of Social Gating keep users out of the community unless they have some basic knowledge of the subject; others regularly delete user accounts that have been inactive for a long period. And charging money is a popular way to maintain the quality of a community.
The second suggestion is to give high status to special contributors of the community. If you have high status in the community, you would have no incentive to leave the community, and it also slows down the speed of the evaporative cooling effect.
The last one is to control both the openness and matching people and content. If your community has high openness to external, and people see can easily see other people in the community or content, the community tends to grow relatively faster. However, this type of community is easily suffering from the evaporative cooling effect.
Social Network Death Spiral
People think Metcalfe’s law is great because they are assuming that N is increasing. But what happens if the N decreases. There is a complemental law called “Eflactem’s Law” and it says “As you lose users, the value of your network is decreases exponentially.”
You can see an example in reality like at a party when popular people start going home, you’ll notice that the quality of the party going down.
Theoretically, the social network death spiral happens when a platform or service acquires the maximum number of people in the ecosystem (N = max), but the value obtainable from the network (= N^2) is less than participants expect.
In this case, the retention rate would be terrible and the network will be pretty much screwed. Because as explained in Efactem’s law, people start leaving the service or platform and it accelerates other people to leave, too.
But if some part of a local network already reached the critical mass and it’s enough big, the network will be retained.
• Social network death spiral: How Metcalfe’s Law can work against you by Andrew Chen (@andrewchen)
Confusing Concepts
In this section, I list up confusing concepts related to network effects.
Viral Effects & Virality
People sometimes confuse the viral effect and network effects. But network effects are about retention and defensibility and viral effects are about getting new users to use your product.
It is said that creating a product with a viral effect is easier than creating it with a network effect. And a product is not necessary to have a network effect even though it has a viral effect, vice versa. For example, products with viral effects such as JibJab, Buzzfeed, or QuizUp succeeded, but they didn’t have network effects and they disappeared in short term.
Geometric (Exponential/Non-Linear) Growth vs. Linear Growth

Services or products without viral and network effects tend to grow linearly. But once the businesses with network effects reach the critical mass, they show non-linear growth because either they can afford to buy the traffic compared to competitors, or they have a viral effect.
Reinforcement
It’s pretty easier to build other types of defensibilities on top of the business with network effects once you realize the network effects. Building new defensibilities are affecting and reinforcing each other. This is called reinforcement.
Economies of Scale (Scale Effects)
“Economies of scale are cost advantages reaped by companies when production becomes efficient. Companies can achieve economies of scale by increasing production and lowering costs. This happens because costs are spread over a larger number of goods.”
When a scale effect starts to kick in, for customers, it’s obvious to choose a company with a scale advantage. Because more users bring greater volume, and it leads to cheaper prices from suppliers, then the price becomes lower for customers.
Brand
As shown in the chart, the brand is one of the powerful defensibilities for companies, and it’s different from network effects. When people are aware of who you are and what you do, your brand emerges. There are psychological switching costs associated with a well-established brand identity. People are less inclined to transfer from your brand to an unfamiliar or lesser-known brand since they have a psychological preference for what they are familiar with.
Embedding
Embedding is also one of the powerful defensibilities for companies as shown in the chart as “EMBED”. Embedding is achieved by integrating your product directly into client activities, making it impossible for the customer to tear you out and replace you with a competitor without paying considerable time, energy, or both costs. Meaning, it enhances the switching cost directly.
Embedding is more prevalent when customers are organizations, not individuals. Because it’s difficult to embed in personal life operations. Examples of embedding are Workday, Oracle, and SAP.
—
Hope this article helps you understand the whole picture of network effects. If you have any questions, please DM me on Twitter or LinkedIn.
Remember what you should do next?
Don’t just read this article or the attached product management articles. Instead, highlight where you resonate with and leave your thoughts and learnings with Glasp so that you can look back at them anytime and we all can get smarter at the same time ;)
See you next time,
Kei
—